

You may have noticed something new this week in your Google Analytics account; Google has just announced that benchmarking will be now be available in your Analytics dashboard. The feature, available to website owners who have enabled anonymous data sharing, became available to some sites this week, and will continue to roll out to all webmasters over the coming weeks.
Long-time marketers may recall that Google offered benchmarking reports in the past, however the feature was deprecated due to the relatively low adoption rate. It’s a bit of a mystery why they made the decision to re-implement the reports; however most marketers are glad they did!
Benchmarking has always been an important way for businesses to gauge how they compare to others in their industry, and Google’s benchmarking reports are going to be a valuable way in which we can do this. Benchmarking reports, accessible under Audience>Benchmarking, will allow website owners to compare various aspects of their site’s performance to other similar sites in their industry.
Webmasters can select from 1600 industry categories, 1250 markets and 7 size buckets. This means comparisons will be more accurate and more relevant, and will give business owners access to a level of competitive intelligence that would otherwise be very difficult to come by.
What is Benchmarking?
I’ll dig deeper into Google’s benchmarking reports in a minute, but thought it would be helpful to first talk about what benchmarking is, and why it’s so important (particularly in a hyper-competitive market or industry).
A benchmark is defined as “something that serves as a standard by which others may be measured or judged”. As it relates to business, benchmarking is a way of comparing strategies or procedures to a particular standard measurement; and this measurement will differ depending on what type of benchmarking we’re talking about.
Internal benchmarking would be comparing a company’s performance to a set of best practices; for instance, looking at how a company’s current product return rate compares to the set ‘ideal’ return rate. In this example, the benchmark may be a return rate of 1%; every quarter the rate is compared to this ‘best practice’.
Internal website benchmarking follows a similar pattern, although of course it compares aspects of a website to a particular ideal or benchmark. For instance, a business may want to see how this month’s referral traffic compares to an identified optimal level (like 15% of total overall website traffic).
External benchmarking, on the other hand, looks at how a particular metric or practice in a company compares to that of their peers: for instance, using the example above, how a company’s return rate compares to the industry standard for returns.
External website benchmarking – which is what we now have access to via Google Analytics – allows us to compare various aspects of a website’s performance to those of other, comparable sites in the industry.
Why Should I Use Website Benchmarking?
Measuring various aspects of your performance against your competitors helps you set meaningful goals for your website. While internal benchmarking and a commitment to using best practices is important, external benchmarking is what gives your site a competitive edge.
When you understand how other sites in your industry are outperforming yours, it gives you a solid, clear mandate for your own site. For instance, if you know that other sites are getting higher numbers of mobile traffic, looking into your own mobile strategy may be important.
External website benchmarking can also help you hold onto your competitive advantage in areas where you’re outperforming your peers. For instance, if you discover your referral traffic is higher than average, you may wish to look for ways to maintain that advantage (ex. nurturing relationships with bloggers in your niche.)
What Metrics Can We Compare Using Analytics Benchmarking?
There are numerous factors we can potentially compare using benchmarking, although many of these won’t yet be available in this initial rollout of Google Benchmarking (categories available in GA are marked with a * below).
Load Time: We know that users are quick to give up on sites that don’t load quickly, so ensuring your site meets industry standards for load times is important.
Content: There are many aspects of a page or article we can measure, including readability score, keyword density, text formatting, use of images, etc.
Usability: How easy is it to navigate around a site, or to accomplish the task required by the page (ex. filling out a form, making a purchase, etc.)?
*Location: Countries and territories of site visitors.
*Sessions, % of new sessions, pages per session, and average session duration: These metrics will allow you to compare your traffic levels to those of other sites. For instance, referral, paid, organic and email traffic.
*Bounce Rate: Will show how a site’s bounce rate (the rate at which users leave the site without viewing another page) compares to the rates of its peers.
*Device: How do the number of desktop, tablet and mobile users of the site compare to industry averages?
I’d Rather Not Share My Data with Google. Can I Still Use Benchmarking?
Unfortunately, Google relies on webmasters anonymously sharing their website data to make this service function. For this reason, sites that don’t have data sharing enabled will be unable to access benchmarking.
Website owners needn’t be afraid to share their data, however; the data is aggregated with that of other comparable sites, and cannot be traced back to your site. According to their policy, “Google removes any information that might identify the source websites, combines the data with other sites that use Google Analytics in comparable industries and reports aggregate trends. Shared data can’t be tied back to individual accounts.”
To enable data sharing, log in to your Google Analytics account and click on ‘Admin’. Under the ‘Account’ column, select the account you wish to edit, and then click ‘Account Settings’. Finally, select ‘Anonymously with Google and others’ to enable sharing.
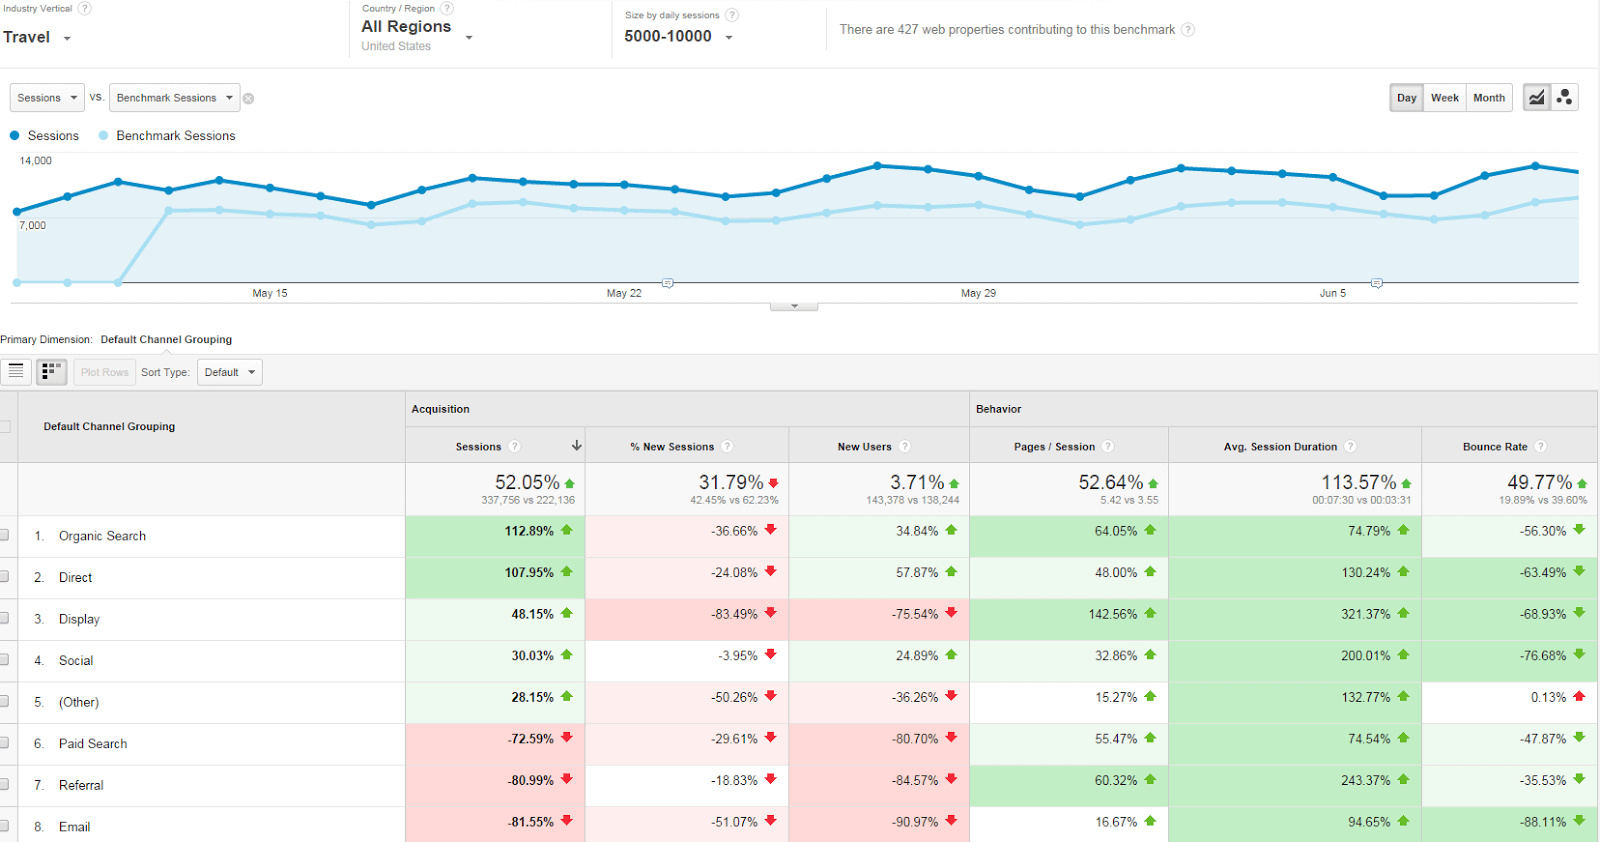
Understanding Benchmark Reports
For each metric that is displayed in the report, a comparison between your site’s performance and that of your peers’ is shown. For instance, if your bounce rate was 42.5% and the industry average was 50.80%, your bounce rate would be expressed in red as a negative number. This indicates that you are underperforming in this area relative to other, comparable sites.
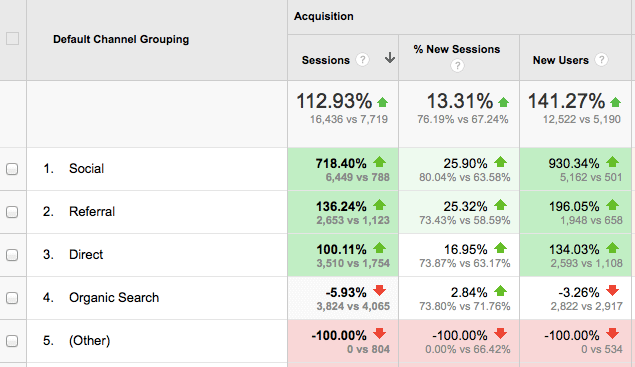
For metrics where you’re outperforming industry averages, the number will be shown in green and expressed as a positive percentage. If we look at the screenshot below, we see that this site significantly outperforms its peers in terms of social, referral and direct traffic, but underperforms when it comes to organic search traffic.
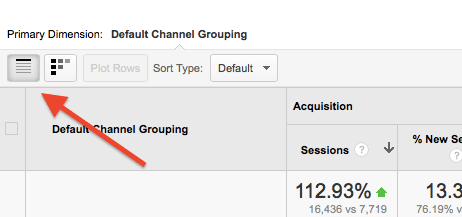
You’ll find you’re also given the option to adjust how and what you view in the report. By clicking on the icons at the top left of the report, you can select whether you’d like to display the red/green colour indicators and numerical comparisons. The arrows and percentages will be displayed by default.
If you haven’t already enabled anonymous data sharing*, I’d strongly encourage you to do so. Understanding the environment and context in which you’re competing can give you powerful insights and can inspire new strategies for improving your website’s performance.
*Note: Once you’ve changed your data sharing settings, it may take some time for benchmarking reports to appear in your dashboard. For this reason, I’d recommend you enable data sharing as soon as possible.
What do you think of the new benchmarking reports? Have they revealed any interesting data about your site’s performance?